Stock Buybacks | False Buybacks
Narration from Chapter 6, which is based on the research below.
Stock buybacks cannot be treated as returns to investors because public companies can rescind what they returned through dilution.
This paper defines False buybacks as situations when the shares outstanding for a company does not decrease around the year it announced stock buybacks.
The research looked at 2,055 public companies that announced or engaged in stock buybacks between 2009 -2016, and found 63% of the buybacks were false.
Most of the false buybacks were from companies that paid dividends, which opens new questions about the legitimacy of dividends.
If public companies are consistently buying back stocks, why are there so many public companies remaining public?
Background
Stock buybacks are situations when companies buy back their stocks. At first glance, buybacks look like an alternative dividend because it’s money being returned to investors by the underlying companies. However, unlike dividends, which are paid and done, buybacks can be rescinded through dilution: when companies issue more shares. Dilution can come from initial public offerings by new companies, secondary offerings by existing companies, or employee stock compensation. All three scenarios add new shares to the market and extract money from investors. People in finance often quote buybacks as returns without considering dilution. It’s common practice, but it’s as foolish as saying “revenue = profit” without considering the expense.
Without any further investigation, it is possible to conclude, logically, that stock buybacks can never be treated as returns to investors because the underlying company can take back what it returned. The only way stock buybacks can be treated as a return is if the underlying company guarantees it will never issue new shares after the buyback.
Facts about Buybacks and Dilution:
There are two ways to look at returns from buybacks. One is from an equity risk premium (ERP) perspective that looks at buybacks and dilution for the overall market. Another looks at the buybacks and dilution of specific companies. The proper way to calculate returns is to take the difference between how much a company or companies spent on buybacks and how much they received from investors through dilution. The only difference is that the overall market returns will include dilution from new companies and their IPOs.
Buyback Returns = Total Buybacks – Total Disulution
The formula is straight forward, but the data are not. A lot of research companies track buybacks, but the numbers are based on announcements, not transactions. And, according to the Securities and Exchange Commission (SEC), public companies are not legally obligated to buy back their stocks after the announcement. On the other hand, no one tracks the data for dilution. It’s not hard to find the shares outstanding, but it doesn’t show how much money was taken from investors when the diluted shares were issued.
The economist, Robert D. Arnott, came up with a ratio to estimate dilution with the total market capitalization and the changes in the price index[1]. His research looked at the effects of dilution between 1926 – 2010 and concluded, “New share issuances almost always sharply exceeded stock buybacks [every year].”[2] Arnott assumed the dilution was the result of new companies issuing stocks while mature companies repurchased them at a slower rate. Like other equity researchers, he did not consider disturbing scenarios where the same firms that are buying back stocks are also printing additional shares to nullify the buybacks.
Equity researchers typically assume public companies have the investors interest in mind, which is why this will be the first research (to my knowledge) that investigates dilution from buyback companies. One of the objectives for the research is to see if companies engaged in false buybacks, which I define as: a scenario where the shares outstanding for a company do not decrease around the years it announced or engaged in stock buybacks. Another objective is to see if non-dividend companies are more likely to engage in false buybacks.
The list of buyback firms came from MarketBeat.com, and the shares outstanding and dividend data were from an academic database. The shares outstanding data are split-adjusted and scaled to properly account for the variations between firms that have millions of shares and others that have billions.
This research investigated 2,055 public companies that entertained buybacks between 2009-2016, and their share-counts over a five, fifteen, and twenty-year period. The five-year study included almost all the companies that announced buybacks on the focal-year—the year the buybacks were announced. The sample for the fifteen and twenty-year studies included about half the companies that announced buybacks between 2009-2016.
The data became less consistent over more extended periods of time, which is why the sample size for the extended study was smaller relative to all the firms that announced buybacks between 2009-2016. Only the companies with comprehensive and consistent data were used in the studies, and the problematic companies with inconsistent data were left out. This is typically true for most equity research. The companies that didn’t survive the test of time (bankruptcy, buyouts, etc.) become missing data, and the data used in the analysis is likely to have some form of survivorship bias[3]. The real results are probably more pessimistic than what is published.
Five-year Study
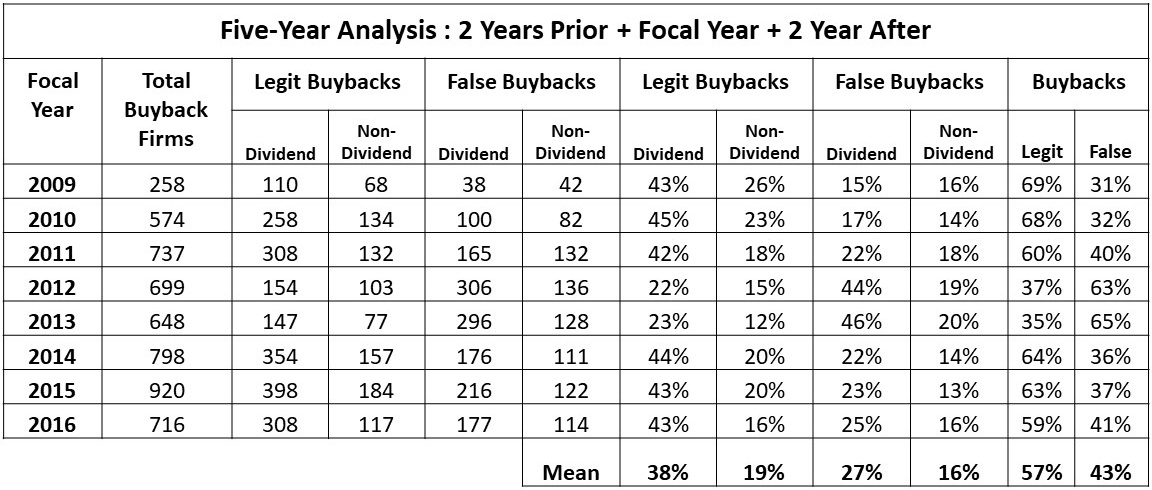
The five-year study looked at 2,055 firms that announced buybacks between 2009–2016. If a firm announced buybacks in 2013, the investigation period was from 2011 to 2015. The legitimate buybacks will show a decrease in shares outstanding, and the false buybacks will show an increase or stay unchanged. Table 1 has the results from the study and shows an average of 43% of buybacks on any given year were false. The results were much higher than expected, but the real surprise was how most of the false buybacks were from companies that paid dividends. This was an unforeseeable discovery and something we’ll take a closer look at later.
TABLE 1. Buyback Analysis, Five-Year Outputs
Extended Study
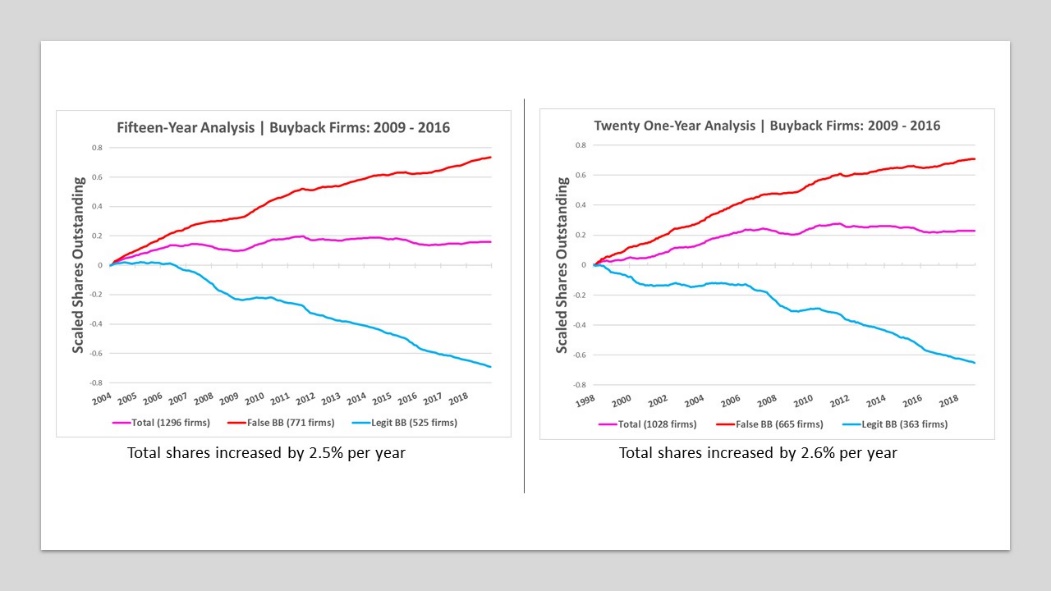
The fifteen and twenty-year studies looked at 1,274 firms that announced buybacks between 2009 – 2016. Table 2 shows roughly 61% of the firms engaged in false buybacks, and about 73% of the false buybacks were from dividend companies. The false buyback firms from the five-year study exhibited the same pattern of behavior in the extended analysis, but some of the legitimate buyback firms from the five-year study were actually engaging in false buybacks over the long run.
TABLE 2. Buyback Analysis, Fifteen and Twenty-Year Outputs
FIGURE 1. Fifteen and Twenty-Year Analysis
The proportion of false buybacks increased from 43% in the five-year study to 61% in the extended study. The increase was unexpected but also made sense. Older public companies are probably more likely to dilute, which is why they are still public. Companies like Morgan Stanley and AT&T have been buying back stocks for almost a century. If the buybacks were legitimate, they should have acquired all their shares by now and become private. Table 3 has a list of notable companies that engaged in false buybacks in the fifteen-year study.
TABLE 3. Notable Dilutors
TABLE 4. Extreme Dilutors
Table 4 has a list of some extreme dilutors who had shares outstanding that increased as much as 6,432% percent. These extreme cases were the result of standard dilution from printing shares and multiple reverse splits in efforts to salvage the stock price. For example, the biotechnology company CYTR had about 804,000 split-adjusted shares at $2/share in January 2004. By 2012, the price dropped to $0.32/share, at which point CYTR did reverse split (combined 12 shares into 1) to raise the price to $3.81/share. By 2017, the price dropped to $0.36/share, at which point they did another reverse split to bring the price up to $2.18/share. By December 2018, CYTR’s total shares outstanding was 33.6 million, which is astronomically higher than what they started with in 2004.
From CNBC and Bloomberg’s perspective, CYTR is a company with a history of buying back stocks. They don’t look at the dilution and how the firm has stayed alive with a series of reverse splits to alter the price. Of the 755 firms that engaged in false buybacks in the fifteen-year study, 53 had increases in shares outstanding of over 500%. These extreme cases show how easy it is for companies to use stocks to game the system. What CYTR has been doing is a form of price manipulation, but the actions are also legal. It’s important to keep in mind that CYTR was investigated in this research because they were part of a sample of companies that entertained stock buybacks. The sample doesn’t include the thousands of companies that didn’t even entertain buybacks but might share the same behavior.
SEC Filings:
The SEC does not require companies to report the specifics about dilution in their filings. There is some information in the Consolidated Statements of Cashflow, but there is no obligation to report any details. I looked through the filings for a few companies that entertained buybacks in 2013 and found the following:
BlackRock (BLK): Issued 26,211,335 shares with what sounded like a secondary offering in 2012 (language included unclear legal jargon that requires a specialist to interpret). They bought back 8 million in 2013.
Bank of America (BAC): The details for the dilution were unclear, but the shares outstanding increased by 611.2 million in 2011 (February 2011: 10,121,154,770 shares. February 2012: 10,732,388,501 shares.). They bought back 231.7 million shares in 2013.
AT&T (T): The details for the dilution was unclear, but the shares outstanding increased by 961 million in 2015 (February 2015: 5,190,167,853 shares. February 2016: 6,151,208,898 shares.). They bought back 300 million shares between July 2012 and May 2013.
Morgan Stanley (MS): Issued 385 million shares with what sounded like a secondary offering in 2011. In 2013, they announced the approval of $500 million in buybacks, which could have acquire about 19.2 million shares (based on the average price of $26/share in 2013), but it is unclear if the buybacks took place.
The filings show some of the dilutions were from what sounded like secondary offerings and some buybacks were just announcements. Figure 2 shows that the dilution can take place before or after the buyback announcement.
FIGURE 2. Shares Outstanding Graphs
False Dividends
The data shows that most of the false buybacks belonged to firms that paid dividends. This was an unexpected discovery and opens new questions about the legitimacy of dividends—a topic that was unforeseen at the beginning of this research. The main question we want to answer is: are companies paying dividends with the money they receive from issuing diluted shares? It doesn’t matter if the dilution is from secondary offering or employee stock compensations. Ultimately, the money will come from the investors. If a company is simultaneously diluting while they pay dividends, then the money they are receiving from selling diluted shares to investors are also being used to pay dividends. The company will not draw a straight line between the two actions, but it’s clear that money is going into a pot that gets mixed and paid out to other investors. That’s how capital gains work, but now it’s also true for many dividends as well.
Dilution typically comes from employee stock compensations or secondary offerings. Secondary offerings look worse on the surface because the shares are sold directly to investors. However, employee stock compensation is essentially the same thing. The only difference is, the stocks are issued to employees, who will then sell it to investors. The idea of employee stock compensation is nonsense. The idea of employee stock compensation is nonsense because the perception is, companies pay their employees with stocks. But the reality is, companies print stocks, and investors who buy stocks pay their employees. If stocks are a real form of compensation, the CEOs and employees should hold those stocks forever. They should not feel the need or be allowed to cash in the paper they printed for themselves with investors and pension plans.
Conclusion
This research has definitively shown why buybacks cannot be considered returns to investors. From a logical perspective, buybacks cannot be regarded as returns when companies can rescind what they returned through dilution. From the data perspective, we can now conclude that most buybacks are false buybacks. Most companies will print additional shares before or after the buyback and nullify what they returned or will return to investors. This research only looked at companies that engaged or announced buybacks. It did not investigate the dilution from new companies with IPOs and existing companies that did not entertain buybacks, which means the dilution from the ERP perspective for the overall market is far worse.
This research also elucidates the fact that stocks are not finite. The data shows that most companies are not prudent about issuing diluted shares, but freely prints as many as they need. The non-finite nature of stocks is also why stocks cannot be considered or compared to real assets with tangible or intrinsic value. A real asset must have two critical elements. One, it must be finite with a limited number of owners (shares). Two, it has a value that can be realized without money from other investors—a value that is not strictly dependent on the Ponzi Factor. These elements exist with real ownership. And they also exist with certain stocks like Apple Inc., who pays dividends and buys back shares without printing more (for now).
Lastly, it’s important to keep in mind that history clearly shows dividends from business profits are supposed to be the primary source of returns for investors. The purpose of buybacks is so public companies can slowly acquire all their shares and become private. It was not meant to be a substitute for dividends, and equities are not designed to be Ponzi assets companies can print and buyback at will.
The final data for this research can be downloaded HERE. Please contact us if you find any errors. This research was done with an institutional database, which can have flaws. I’d prefer to check each firm individually against their SEC filings, but it’s not possible for something of this scale.
[1] Arnott’s ratio: Net Dilution =(1+c)/(1+k ) – 1 , c: percentage of capitalization increase, k: percentage increase in the value-weighted price index.
[2] Book “Rethinking the Equity Risk Premium,” Research Foundation of CFA Institute, 2011, pp. 86–89.
[3] The missing data can also include companies that were bought out. Equity researchers usually assume buyouts are positive-sum for investors. However, buyouts are just as likely to be negative-sum or neutral as well.


